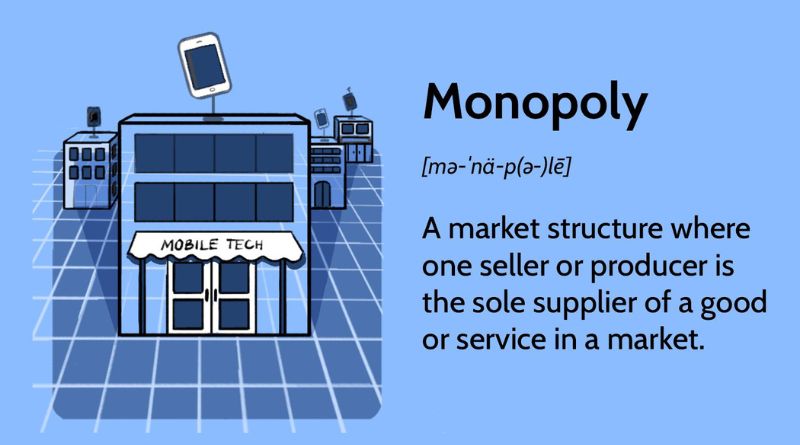
A monopoly is a market structure where a single firm dominates the entire market, controlling the production and pricing of a unique product or service. This type of market structure contrasts sharply with perfect competition, where many firms operate, and no single entity can influence prices. The monopoly graph is essential for understanding how monopolistic firms operate, their pricing strategies, and the implications of their market power.
Table of Contents
Characteristics of a Monopoly
Before diving into the monopoly graph, it’s essential to understand the key characteristics that define a monopoly:
- Single Seller: In a monopoly, there is only one producer or seller in the market. This firm has significant control over the supply and pricing of its product.
- Unique Product: The product offered by a monopolist has no close substitutes, which gives the firm significant pricing power. Consumers cannot switch to alternative products if they want what the monopolist offers.
- High Barriers to Entry: Monopolies often have significant barriers preventing other firms from entering the market. These barriers can include high startup costs, control of essential resources, patents, and government regulations.
- Price Maker: Unlike firms in perfectly competitive markets that are price takers, monopolists are price makers. They can set prices above marginal costs to maximize profits.
- Profit Maximization: Monopolists aim to maximize their profits, typically by adjusting the price and quantity of goods produced.
The Monopoly Graph
The monopoly graph visually represents the monopolist’s market power and how it sets prices and output levels. Below are the key components of the monopoly graph:
1. Monopoly Demand Curve
- Axes: The vertical axis represents price, while the horizontal axis indicates quantity.
- Demand Curve (D): The demand curve for a monopolist is downward sloping, indicating that as the price decreases, the quantity demanded increases. This is in contrast to the horizontal demand curve faced by firms in perfect competition.
2. Marginal Revenue Curve
- Marginal Revenue (MR): The marginal revenue curve lies below the demand curve for a monopolist. This occurs because to sell an additional unit, the monopolist must lower the price for all units sold, which reduces total revenue. The MR curve is also downward sloping and intersects the quantity axis at a lower point than the demand curve.
3. Marginal Cost Curve
- Marginal Cost (MC): The marginal cost curve typically slopes upward, reflecting increasing costs as production expands. The intersection of the marginal cost and marginal revenue curves determines the profit-maximizing output level for the monopolist.
4. Profit Maximization
- Equilibrium Point: The profit-maximizing quantity is where the MC curve intersects the MR curve. The monopolist will produce this quantity and set the price at the corresponding point on the demand curve. This price is typically higher than the marginal cost, resulting in economic profits for the monopolist.
5. Graphical Representation
Here’s a summary of how the monopoly graph looks:
- The demand curve is downward sloping from left to right.
- The marginal revenue curve lies below the demand curve and also slopes downward.
- The marginal cost curve slopes upward.
- The intersection of the marginal cost and marginal revenue curves indicates the quantity produced, while the corresponding price on the demand curve indicates the price charged.
Implications of Monopoly
Understanding the monopoly graph provides insight into the implications of monopolistic market structures:
- Higher Prices: Monopolies can charge higher prices than in competitive markets, leading to consumer surplus loss and a reduction in overall welfare.
- Reduced Output: Monopolists typically produce less than would be produced in a competitive market, which can lead to inefficiencies and welfare losses.
- Lack of Innovation: With little competition, monopolies may have less incentive to innovate or improve products, potentially stifling technological advancement.
- Regulatory Oversight: Due to their market power, monopolies often face scrutiny from regulatory bodies to prevent price gouging and ensure fair competition.
- Deadweight Loss: Monopolies can create a deadweight loss, which represents the loss of economic efficiency when the equilibrium outcome is not achievable or not achieved.
FAQs About Monopoly Graph
1. What does a monopoly graph represent?
A monopoly graph illustrates how a monopolist sets prices and output levels, showing the relationship between demand, marginal revenue, and marginal cost.
2. How is profit maximization determined in a monopoly?
A monopolist maximizes profits by producing the quantity where marginal cost equals marginal revenue. The price is then set according to the demand curve at that quantity.
3. Why is the marginal revenue curve below the demand curve for a monopolist?
The marginal revenue curve is below the demand curve because to sell an additional unit, the monopolist must lower the price for all units sold, reducing total revenue on previously sold units.
4. What are the consequences of monopoly pricing?
Monopoly pricing often results in higher prices, reduced output, a loss of consumer surplus, and potential deadweight loss in the economy.
5. How do monopolies differ from competitive firms?
Monopolies are price makers with significant market power, while competitive firms are price takers and have no control over the market price.
Conclusion
The monopoly graph is a critical tool for understanding the dynamics of monopolistic markets. By illustrating how a single firm can influence prices and output levels, the graph highlights the implications of monopolistic power on consumers, innovation, and market efficiency. While monopolies can offer certain benefits, such as economies of scale, their potential to harm consumers and the economy at large underscores the importance of regulatory oversight to ensure fair competition and protect consumer interests.


